
Richard Dougherty, CFP®, AIF®
Partner
With the November midterm election drawing closer, political activity is picking up across the country. As politics become more divisive, it is natural for investors to ask whether election results should affect their financial decisions. The short answer is that it is important to keep political views separate from investing decisions.1
Midterm elections happen every four years, halfway through a presidential term, and decide the makeup of Congress. Right now, polls point toward a divided government, though margins are tight in both chambers.2 Republicans currently hold 219 seats in the House, where 218 are needed for a majority, and 53 seats in the Senate.3 History shows that Washington politics matter far less to long-term investment results than many people expect.
Midterm election years have generally delivered positive market returns
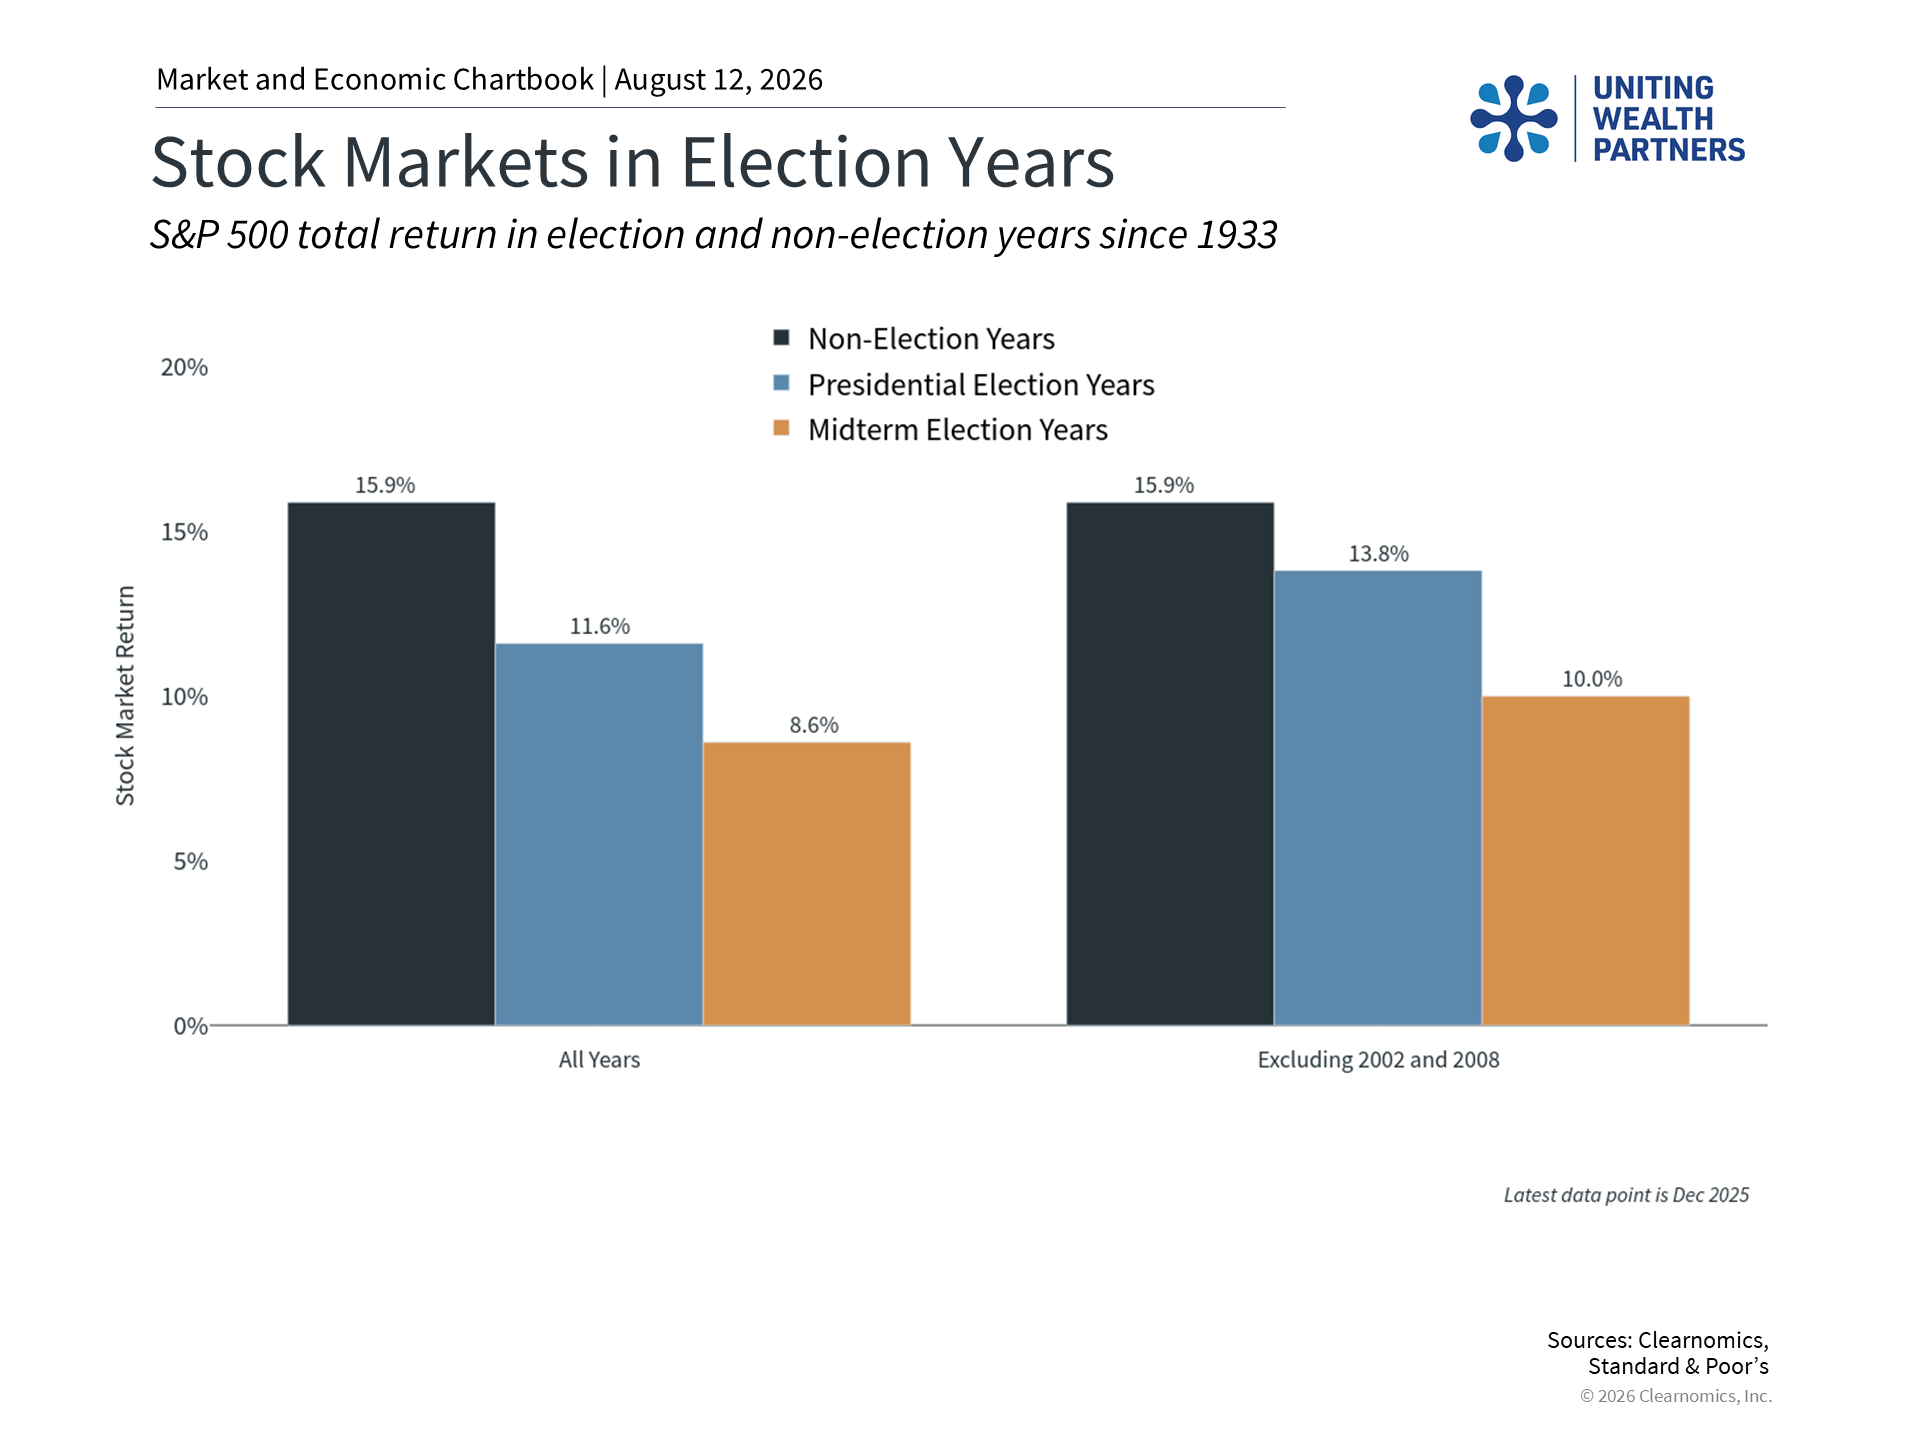
It is easy to assume that election years might hurt investment returns. After all, elections affect economic policy, which can impact businesses and industries. However, history tells a different story. The chart above shows that stock market returns have been positive, on average, across election and non-election years going back to the Great Depression. Markets have done well under both political parties and under divided governments.4
This does not mean every year is positive. For example, 2022 was a midterm year marked by high inflation following the pandemic, and 2018 saw concerns about global growth and interest rate policy. Returns were negative in both years, but those results were driven by economic conditions, not by the fact that they were midterm election years. Longer-term market trends, such as the technology boom of the 1990s or the rise of artificial intelligence today, have generally had more to do with innovation and economic cycles than with who controls Congress.
The economy and interest rates drive markets more than election outcomes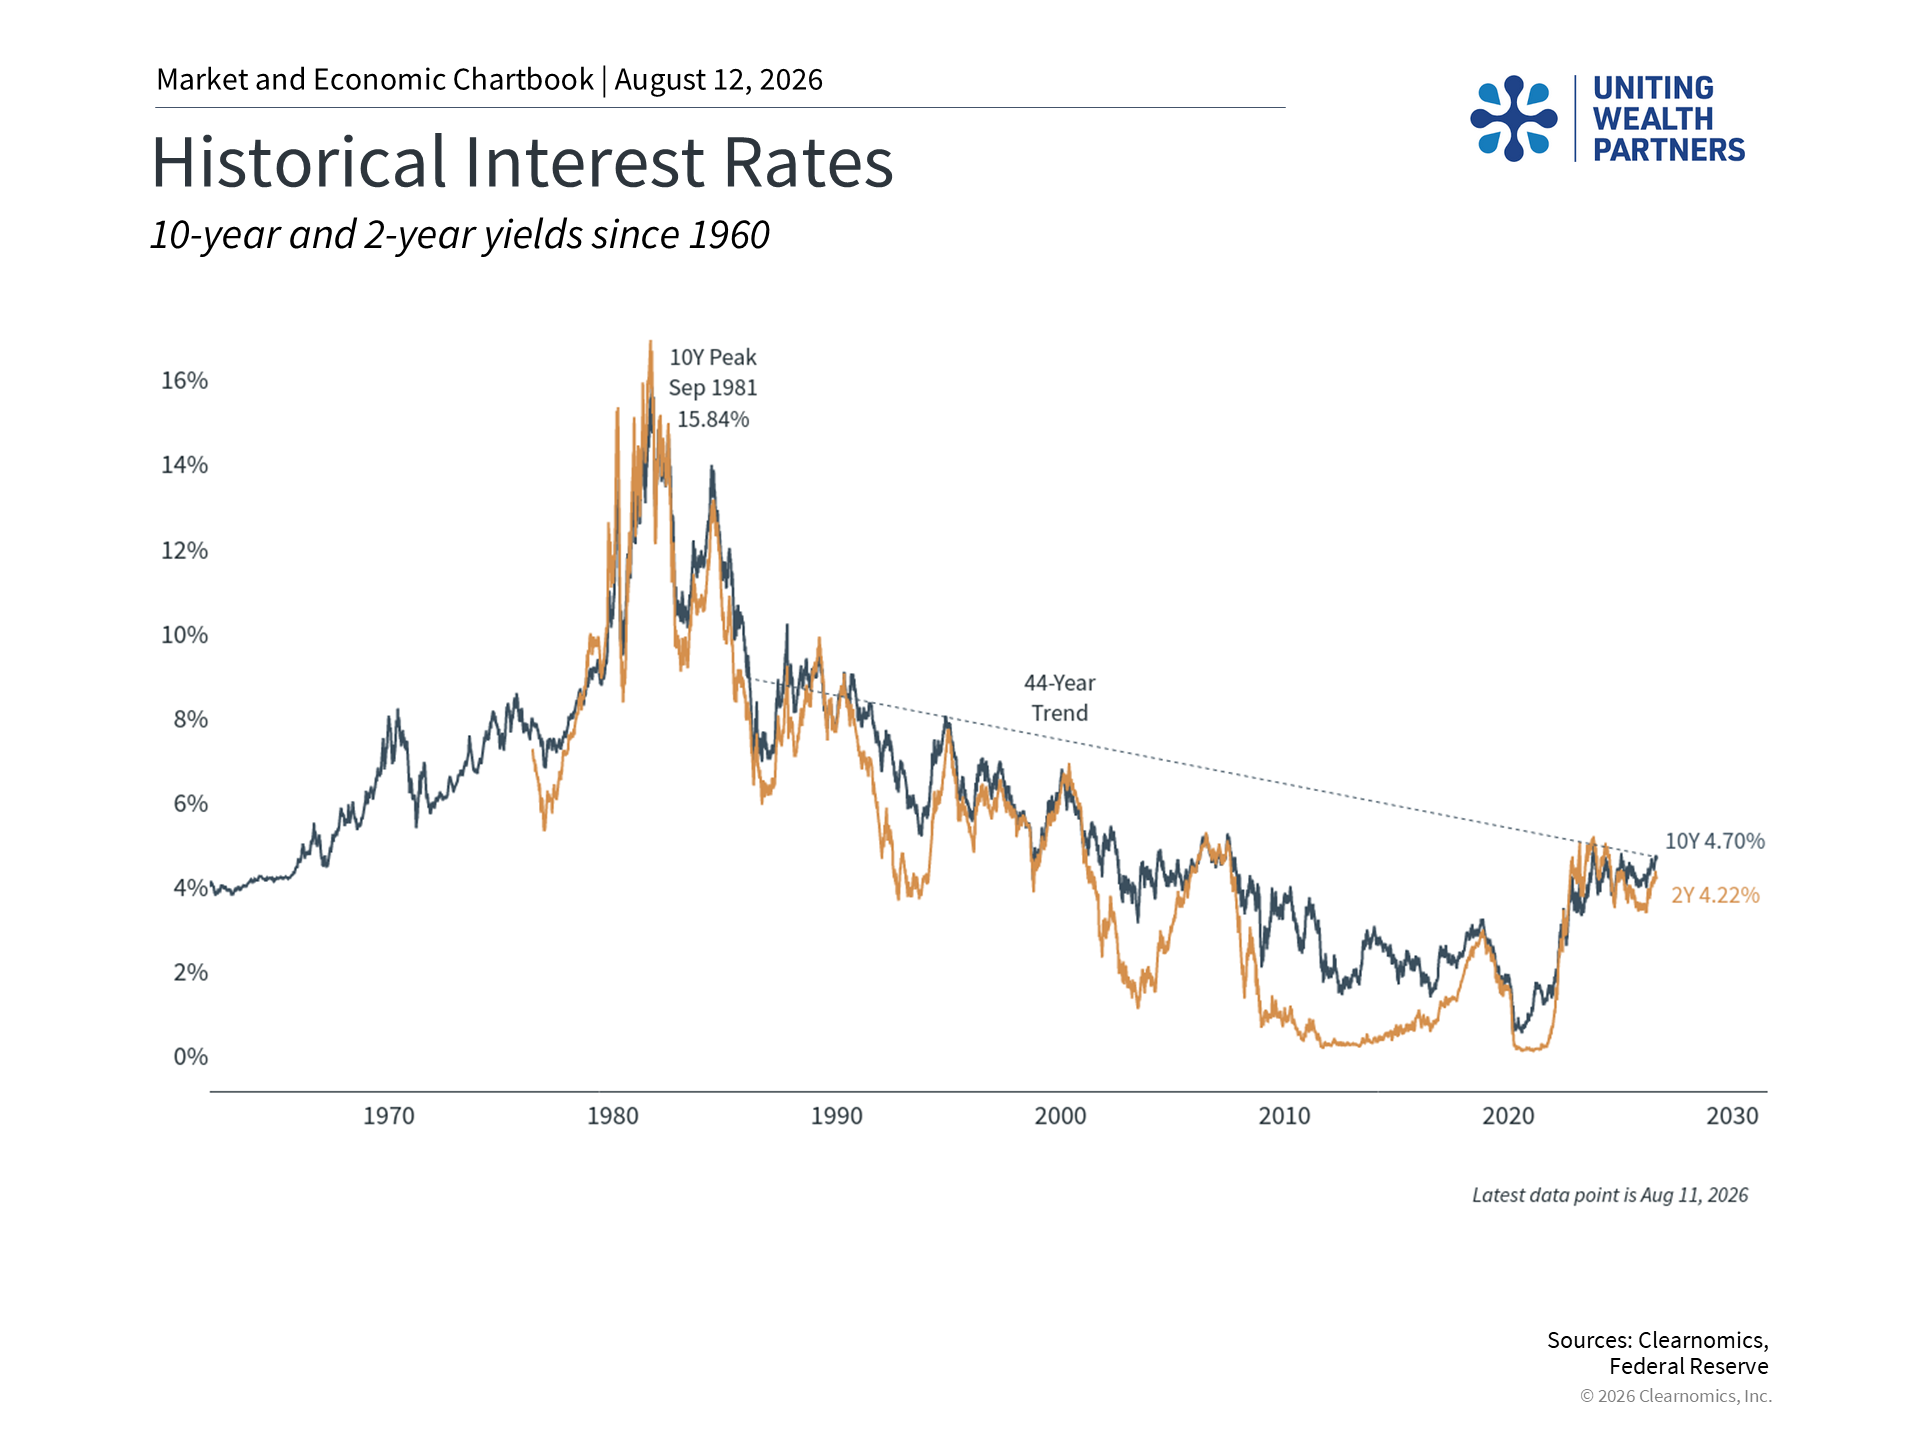
For long-term investors, the business cycle (the natural expansion and contraction of the economy) and interest rates have historically been far more important than election results. The chart above illustrates how the current period of elevated interest rates is affecting markets, businesses, and consumers. While policymakers can influence rates, longer-term economic trends are ultimately what drive them.
Political change also tends to happen slowly and with delays. Even when policies shift in meaningful ways, such as changes to taxes or tariffs in recent years, the actual impact on the economy is often smaller and slower than expected. This year’s election is taking place alongside geopolitical tensions, inflation, and concerns about artificial intelligence, all of which have been bigger drivers of markets than the details of individual Congressional races.
Markets have grown steadily across many different political environments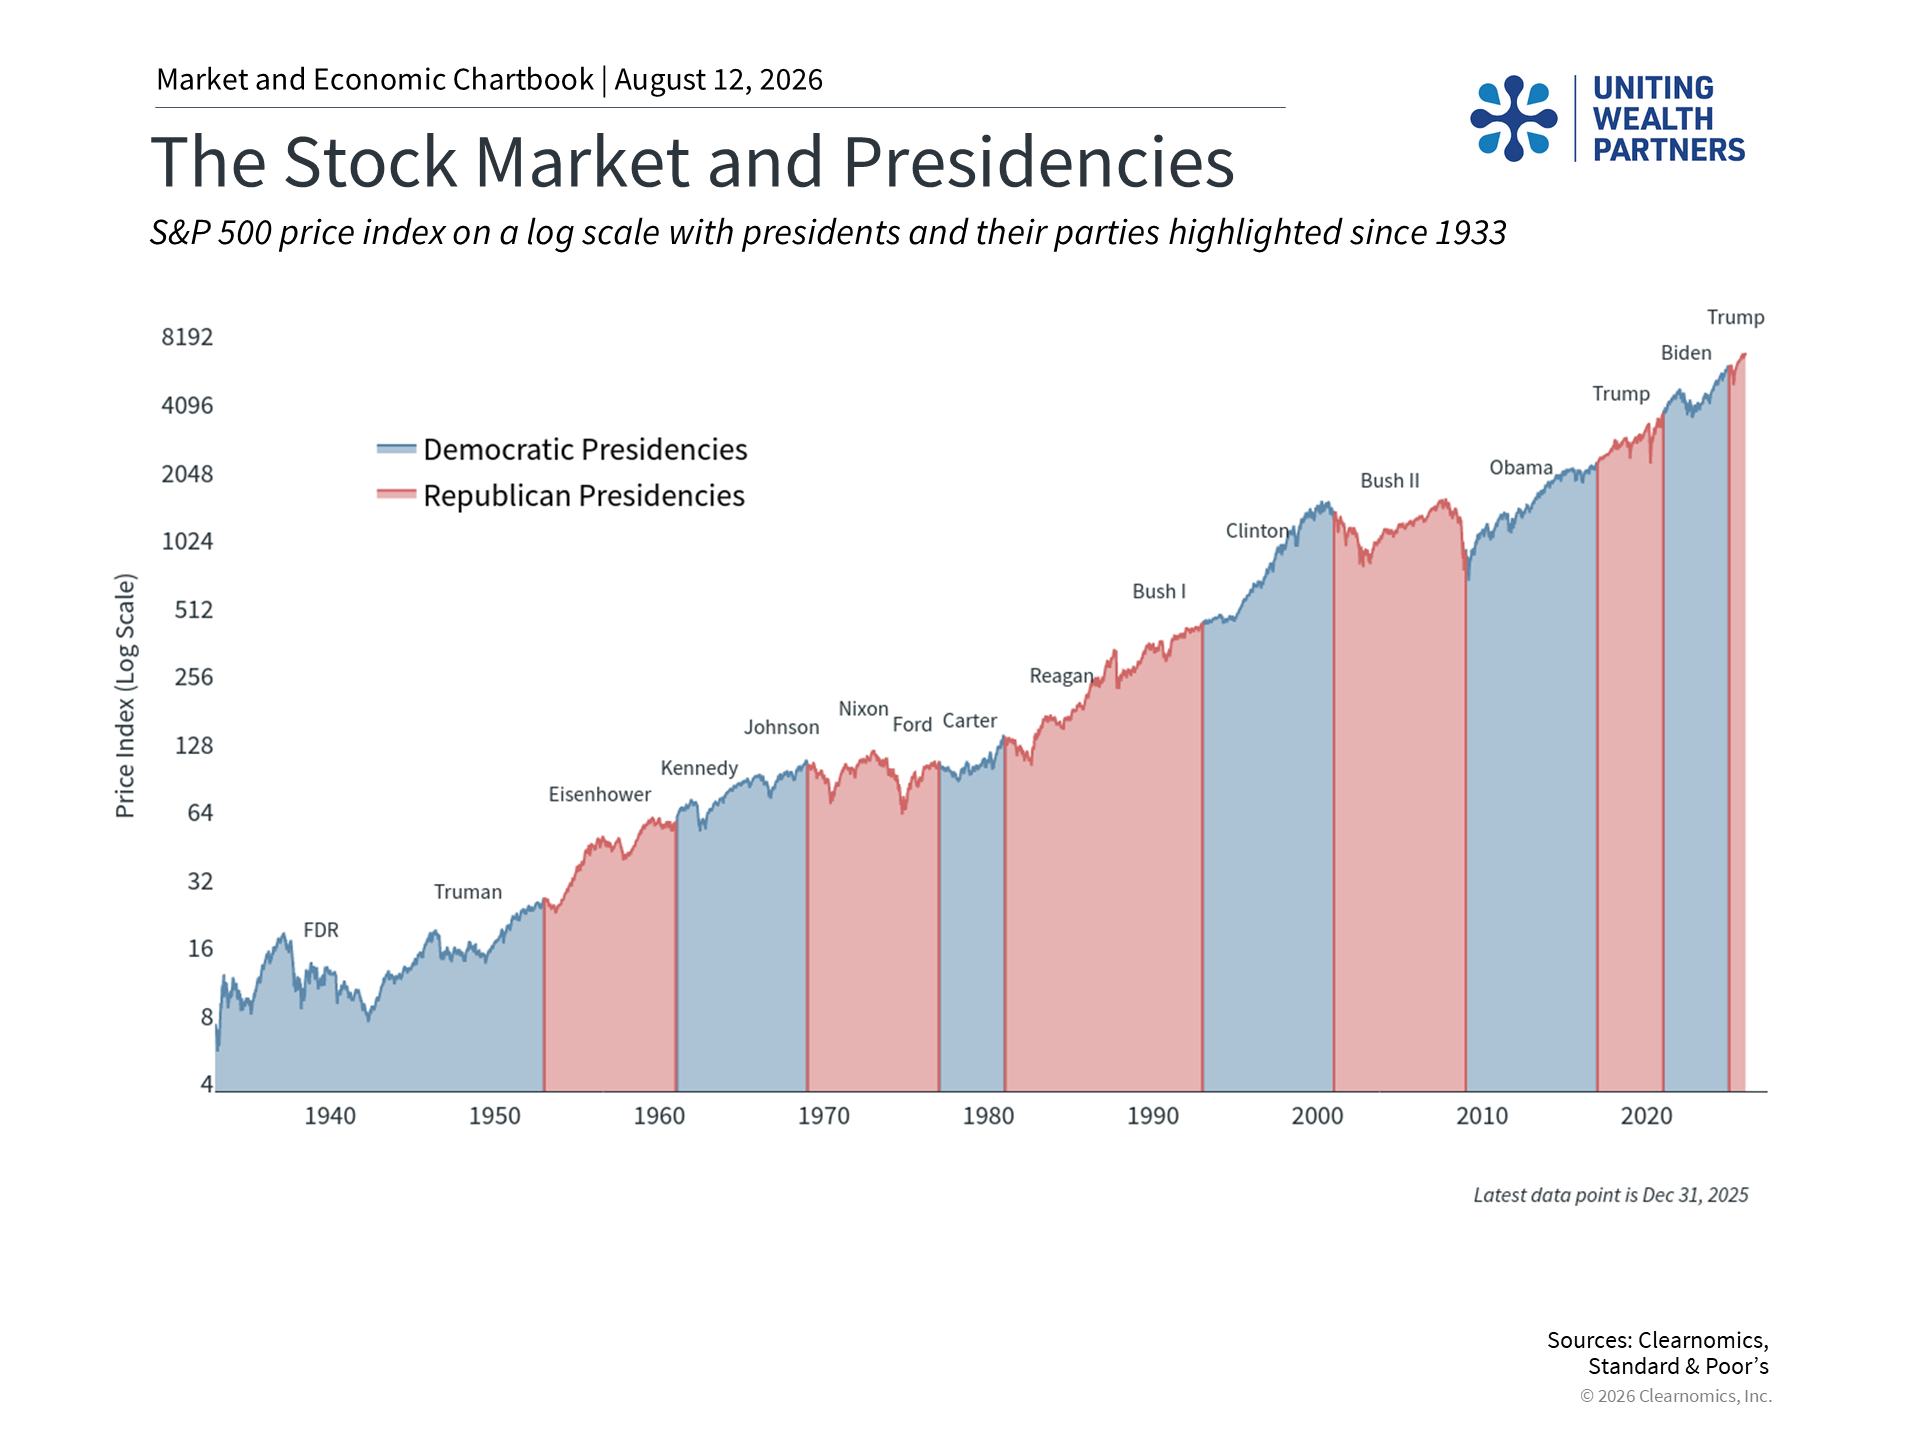
The most reassuring perspective for long-term investors is that markets have grown over time regardless of which party is in power. The chart above shows that the S&P 500 (a widely used measure of U.S. stock market performance) has grown over the past century, through wars, recessions, and major policy changes.5
This does not mean policy is irrelevant. Issues such as tax rates, defense spending, and the national debt can have real effects on the economy over time. However, the key for investors is to focus on what they can control, which is maintaining a well-diversified portfolio built to weather a range of economic and political conditions. Trying to predict election results and adjusting a portfolio accordingly is unlikely to lead to better outcomes.
The bottom line? Midterm elections are important for the country, but it is important to separate politics from investing. History shows that, even during election years, staying disciplined and focused on fundamentals is the best way to achieve financial goals.
References
1. https://www.usa.gov/midterm-elections
2. https://www.realclearpolling.com/latest-polls/2026
3. https://polymarket.com/event/balance-of-power-2026-midterms
4. Clearnomics research and Standard & Poor’s data, as of August 7, 2026
5. Clearnomics research and Standard & Poor’s data, as of August 7, 2026
Index Descriptions
S&P 500
The Standard & Poor’s 500 Index is a capitalization-weighted index of 500 stocks designed to measure performance of the broad domestic economy through changes in the aggregate market value of 500 stocks representing all major industries. The modern design of the S&P 500 stock index was first launched in 1957. Performance prior to 1957 incorporates the performance of the predecessor index, the S&P 90.